GridScout for operators
Know why you were curtailed, what it cost, and what's coming next.
GridScout gives operators rapid insight into project performance: which constraints curtailed your units, what it cost, and how upcoming network outages will affect your assets.
The problem today
You see the lost megawatts. Not the reasons.
Curtailment lands on the revenue line whether or not you understand it. The cause sits somewhere in constraint equations, outage schedules and bid stacks, and digging it out takes time operational teams rarely have.
Post-event analysis is slow
Why was output down yesterday? Answering it means stitching together dispatch, constraint and bid data by hand. The question takes seconds to ask and days to answer.
Curtailment is a black box
Output drops with no clear link to the constraint or outage behind it. Without that link, it's hard to tell a network problem from a bidding problem, let alone fix it.
Outages arrive as surprises
The outage schedule is published, but translating it into project impact is real work. Too often the first sign of a major outage is the revenue hole it leaves behind.
How GridScout helps
From the next outage to the last dispatch interval.
Network outage schedule
See upcoming outages hit your project before they do
GridScout links the NOS to your assets. See which planned outages matter to your project, when they run, and the constraints they bring with them.
Filter the schedule by curtailment impact, NSP outage limits and high price events, and set up custom portfolios so the outages that matter to your fleet surface first.
That forward view of curtailment exposure lets you plan maintenance, bids and revenue expectations around the network, instead of being surprised by it.
Project performance
Evaluate project performance in minutes
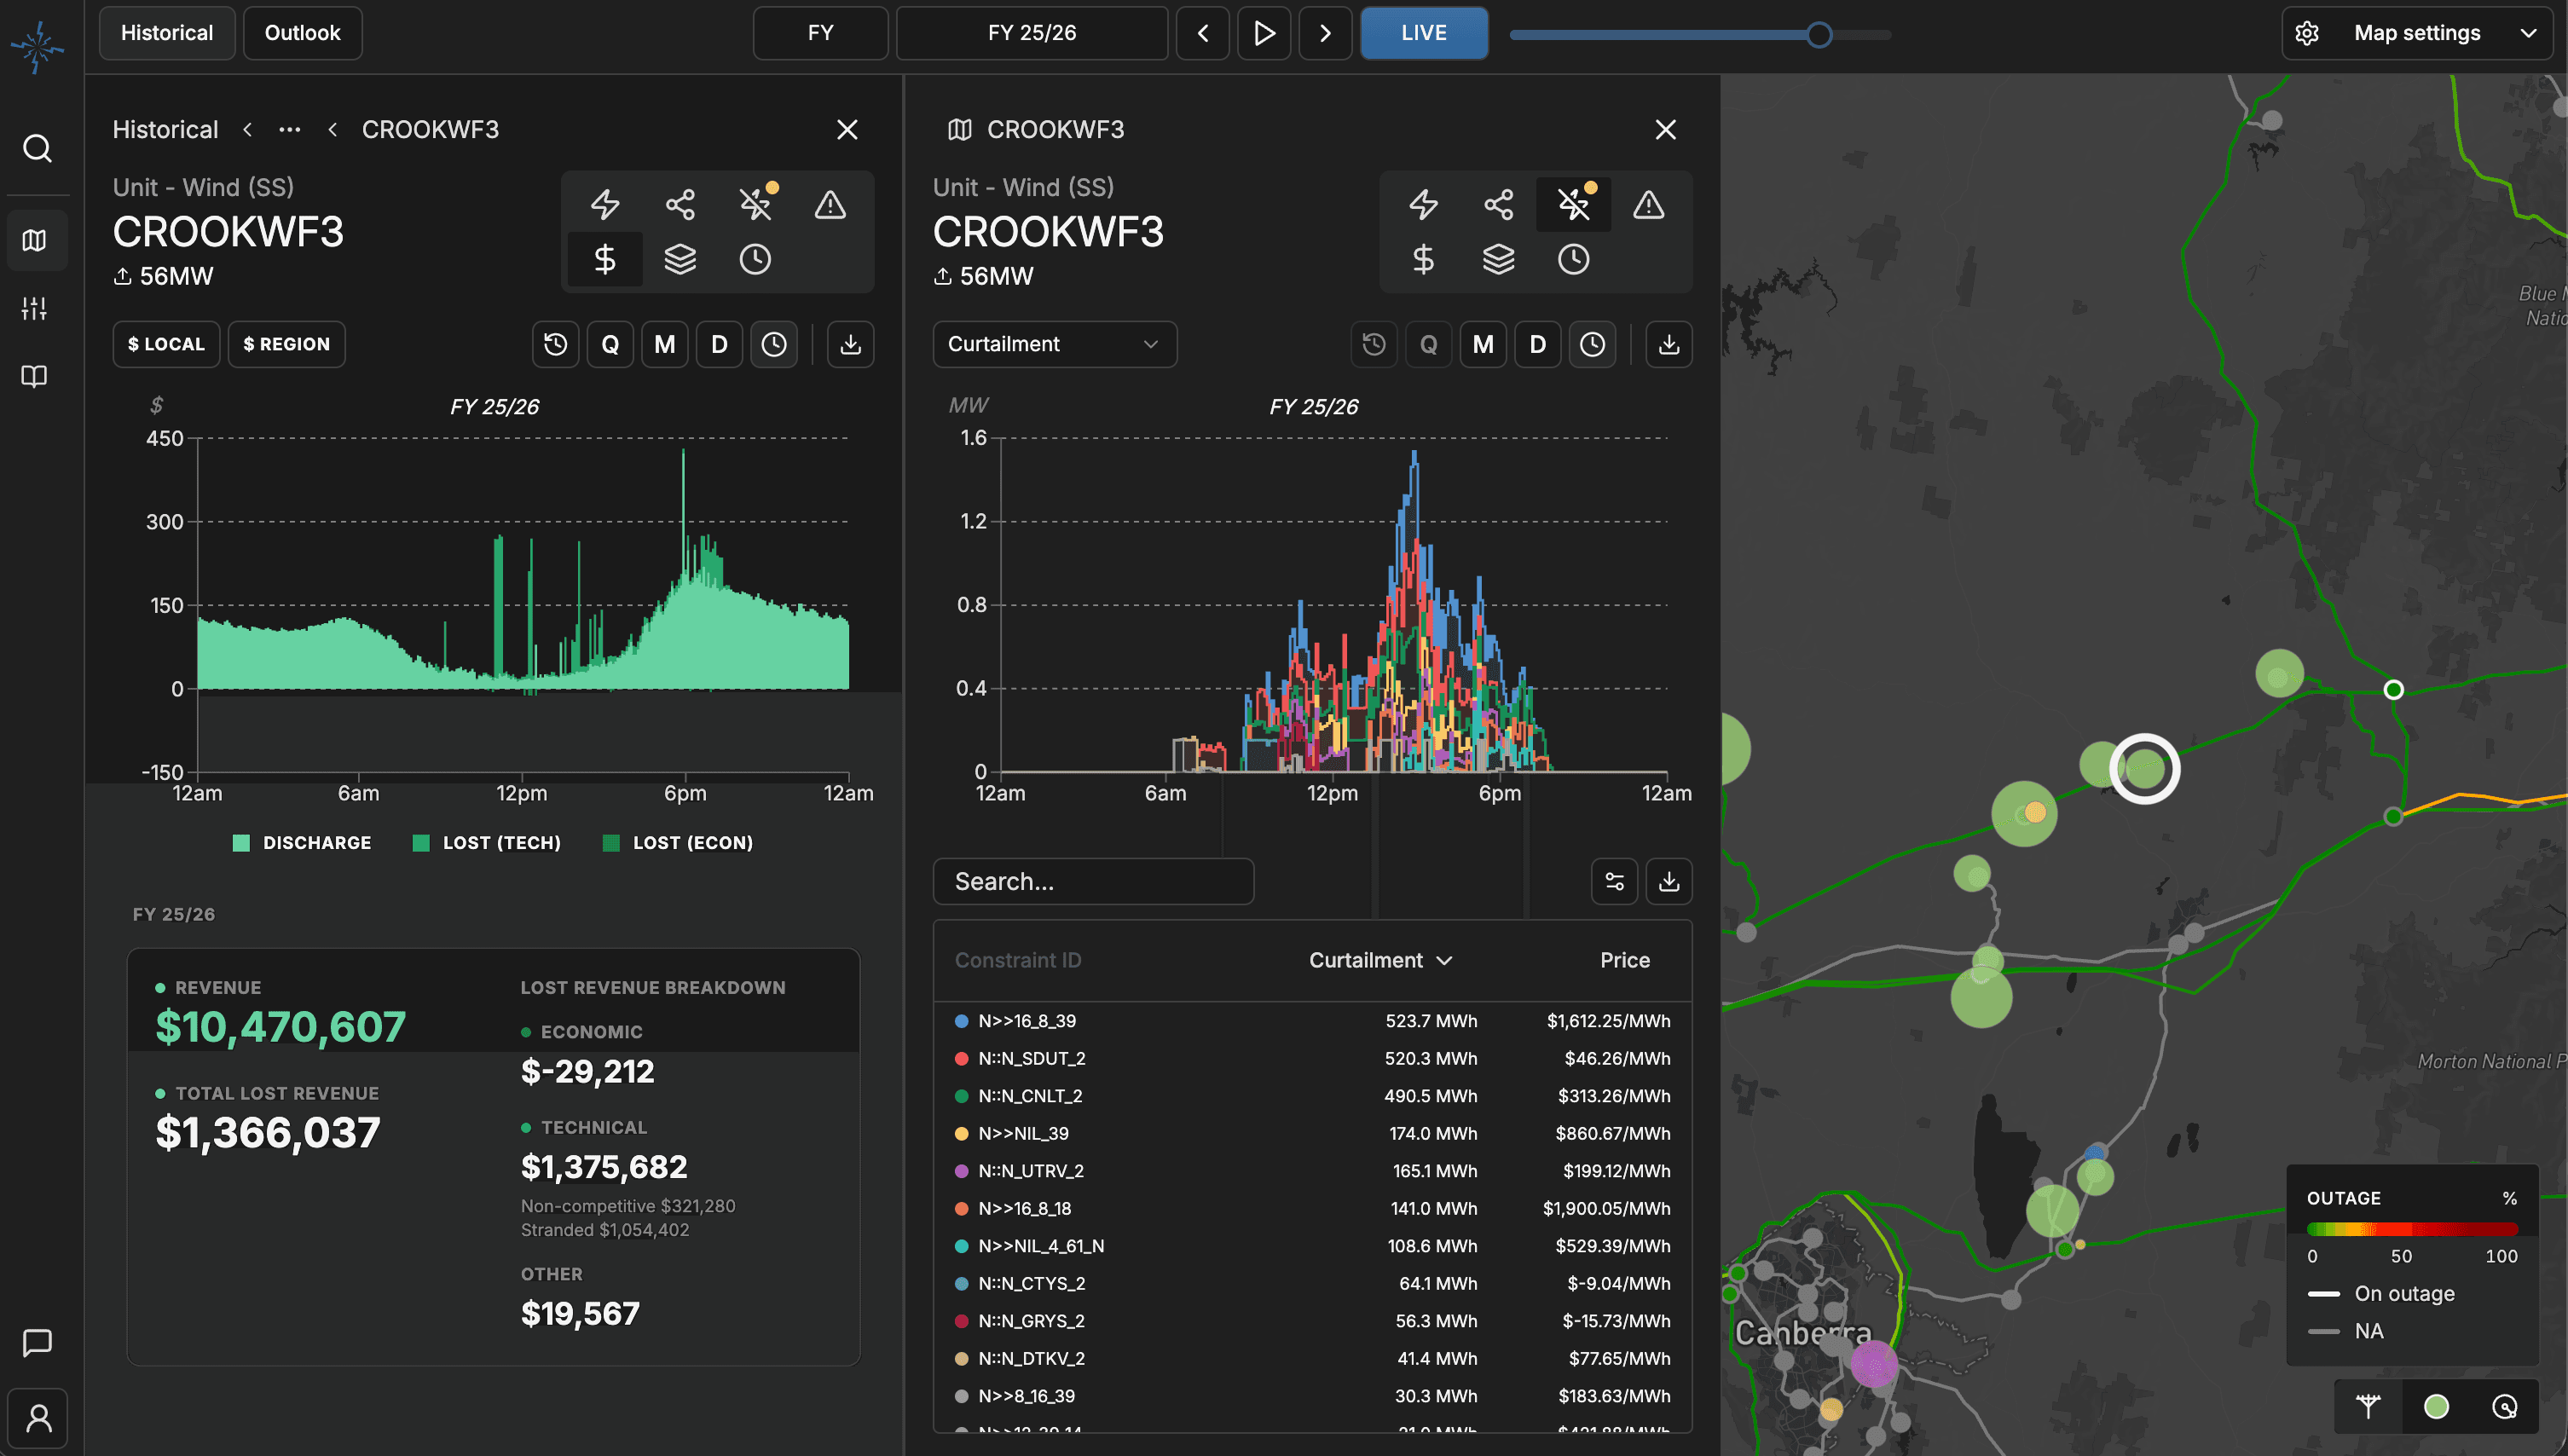
See how your units really performed: the constraints that bound, the curtailment they drove, and the MWh and revenue lost.
Dig into bidding performance around constraints, including technically stranded and non-competitive curtailment, so you know what the network took and what better bidding could recover.
Live network map
Your network neighbourhood, live
Outages, binding constraints, local prices and dispatch on one live map, centred on your assets.
When conditions shift, you see it in context straight away: what changed, and what it means for your units.
Built on the MMS dataset, with customisable export.
GridScout runs on AEMO's Market Management System data: dispatch, bids, constraints, outages and prices, live and historical. If it's in MMS, you can reach it in GridScout, without running your own database.
The payoff
Run your assets with the network in view.
Rapid answers
Performance questions that took days of data wrangling are answered in a session, while they still matter.
See ahead
Forward outage and constraint visibility for your assets, so revenue impacts show up in the plan rather than the results.
Recover revenue
Spot the curtailment you can do something about, and the bidding changes that would have kept you dispatched.